About

Take sessions at any time, at your own pace with unlimited access for 30 days on sign up.

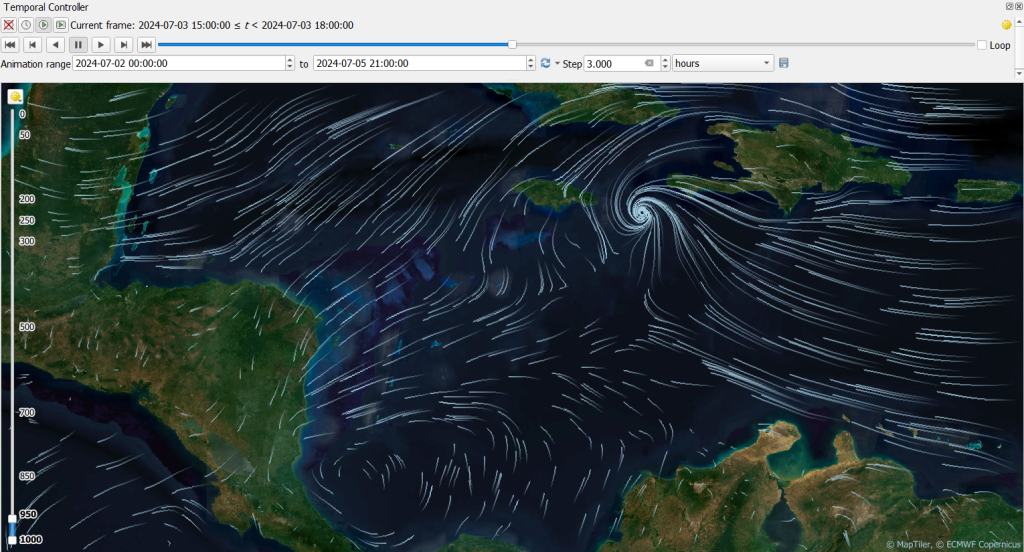
Mesh data is integral to hydrologic, hydraulic, oceanographic, meteorological, and environmental modelling. This course is designed to simplify the process of working with meshed datasets, equipping you with the knowledge and tools to effectively create, edit, or apply mesh data for use in water modelling.

Geospatial data for hydrologic and hydraulic modelling can be defined with raster grids or vector polygons with edges and vertices; each format has it's advantages, and familiarity with both formats allows users to optimise modelling workflows. In this hands-on course, you’ll master common mesh data formats, including NetCDF, using QGIS. Learn to leverage the powerful features of QGIS to analyse, visualise, and animate mesh data with precision. Whether you're mapping hydrodynamic flows, atmospheric conditions, or environmental patterns, this course provides the skills to transform your data into actionable features.

Ideal for modellers and both new and advanced GIS users, this course bridges the gap between raw data and customised applications in your field. By the end of this course, you’ll be equipped with practical techniques to enhance your workflows and communicate complex data insights with clarity, whether you’re applying the brand new meshing tools in HEC-RAS 2025, working with QGIS plugins for TUFLOW, mastering mesh generation for OpenFOAM, or applying your skills to any other modelling platform.

On completion, you will be awarded an internationally recognised QGIS Certificate.

Details

Format 2 x 2-hour sessions + course material & resources
Cost AUD $645.00 (INC GST)
Code OD-25-3-131
Contact training@awschool.com.au
Tags

Presenters

Hans van der Kwast

QWAST

Hans van der Kwast has more than 20 years of experience with GIS and Remote Sensing in education and projects, offering consultancy, training and coaching in open source GIS. He is an active member in... Read more

Kurt Menke

Septima

A former archaeologist and ex-GISP, Kurt Menke is a geospatial generalist based out of Frederiksværk, Denmark. He received a Master’s degree in Geography from the University of New Mexico in 2000. ... Read more

Panel Members

Krey Price

International Water Training Institute

Educated at the University of California at Berkeley, Krey is a civil engineer and project manager with international experience in water resources. He is engaged in computational modelling, engineeri... Read more

Course Overview

This course provides a comprehensive learning experience to enhance participants’ expertise in working with mesh data in QGIS. In this practical, hands-on course, participants will learn to analyse, visualise, and animate data using common mesh formats like NetCDF. Through engaging exercises with interactive, expert guidance, you’ll gain the skills to effectively manage complex datasets and apply them to real-world applications in hydraulics, oceanographic, meteorological and environmental modelling.

To get a sneak peek into the type of visualisations you’ll learn from this course, see the following animation created using QGIS to effectively analyse and present mesh data:


Learning Outcomes

In this course, you will be able to:

  • Grasp the fundamentals of a range of mesh data formats and their applications in various fields such as hydrologic modelling, hydraulic modelling, wave modelling, 3D CFD modelling, oceanography, meteorology, and environmental sciences.
  • Work proficiently with common mesh data formats, including NetCDF, within QGIS.
  • Perform analysis of mesh data to extract meaningful insights.
  • Create compelling visualisations of mesh data using QGIS’s powerful features.


Course Outline

Part 1: Understanding and Visualising Mesh Data in QGIS

  • Theory of mesh data.
  • Loading mesh data into QGIS.
  • Exploring mesh data.
  • Visualising mesh data with the Mesh Styling panel.
  • Animate temporal data.

Part 2: Analysing Mesh Data

  • Using the Vertical Controller.
  • Using the Mesh calculator.
  • Extract time series at a point.
  • Create graphs with the Data Plotly plugin.
  • Create a print layout with maps and graphs.


Format

  • 4+ hours of session recordings with unlimited access for 30-days;
  • Pre-and-post-course materials to go through via the AWS learning platform;
  • Homework exercises between the 2 parts;
  • Manual of the course and working model download/s;
  • Ability to ask questions to the presenters at anytime through the learning platform.


Pre-requisites

  • Basic GIS knowledge.
  • Prior experience using QGIS software, including basic operations like loading data, creating maps, and using plugins.
  • For participants new to QGIS, please view our introductory QGIS webinars:
QGIS for water modellers – Part 1

QGIS for water modellers – Part 2

QGIS Essentials for water modelling

Requirements


Completion certification

  • On completion of the course participants will be issued with an official internationally recognised QGIS Certificate;
  • Attendees earn CPD hours/points (i.e. with Engineers Australia) for at least 4 hours for the entire course. 


Refund Policy

Frequent Asked Questions (FAQs)